In 2021 the UNESCO agreed on their Recommendation on Open Science, a consensus document of 193 countries highlighting values such as equity in open research, alongside principles of sustainability. Improving sustainability is critical from a social, economic, and ecological perspective given the global climate crisis. It is in that vein we investigate the current environmental impact of the corporations running the five most dominant research publishing houses. This helps us understand and qualify how sustainable their research infrastructures are and can initiate a wider discussion on the environmental impact of research infrastructures.
Our analysis aims to draw attention to three interconnected aspects: a) dominant research infrastructures have a substantial environmental impact, b) emissions are selectively accounted for and remain underreported, and c) current climate commitments are often too vague to make a difference. All of these aspects need to be better understood and significantly improved, not least as they could influence choices of infrastructure adoption, funding, collaboration, and more.
Moreover, there are relatively few concrete commitments or efforts to track emissions in initiatives improving research under the header of open science. Without feedback mechanisms, we can only aim but not work towards goals such as “net-zero” or “1.5˚C of global warming.”
One critical step to help shed a light on our environmental impact is to measure the amount of Greenhouse Gas (GHG) emissions related to activities. This process is referred to as “GHG accounting” and the most common standard to do so in a scientific, comparable, and comprehensive manner is provided by the GHG Protocol. This GHG accounting standard also underpins most corporate reporting and disclosure frameworks (including the upcoming International Sustainability Standards).
The GHG Protocol distinguishes three scopes:
- direct emissions (scope 1)
- indirect emissions from purchased electricity, cooling, and heating (scope 2)
- emissions from a company’s value chain (scope 3). Value chain emissions are captured across 15 categories and cover activities such as commuting, home-based working, investments, use of sold products, or transportation.
To transition to “net-zero” and align with climate trajectories identified by science, all three scopes must be measured and reduced.
The GHG emissions of the five biggest scholarly publishers
Measuring emissions is a necessity for research publishing as well, if we take the climate crisis seriously. The activities that need to be accounted for range from the logistics of shipping journals to researchers and libraries, through to the physical servers that host research articles, digital workspaces, and computing clusters. Beyond that, the companies behind research publishing houses generate emissions through events, business travel, office heating and cooling, paper, and printing to name a few.
To investigate the environmental impact of research publishing, we looked at the (self-)reported impact assessments of the largest scholarly publishers. The five biggest publishing houses are Elsevier, Taylor & Francis, Wiley, SpringerNature, and Sage (Larivière et al., 2015). Elsevier and Taylor & Francis do not currently publish their impact assessments themselves. In these cases, we looked at the corporate reporting of their parent companies (RELX and Informa, respectively). Sage did not report or publish any emissions data. We also checked the Publishers Association and STM, both of which pledge to take climate action, however neither publish their impact assessments. It should be noted that companies listed on the stock exchange are required to report on their scope 1 and 2 emissions.
Our analysis of these scholarly publishing houses builds on the following environmental reports:
- RELX (Elsevier; 2006-2021),
- Informa (Taylor & Francis; 2016-2021),
- SpringerNature (2017-2021),
- Wiley (2020).
The collected data is summarized in Figure 1 below. All underlying data can be found in Berger & Hartgerink (2022).
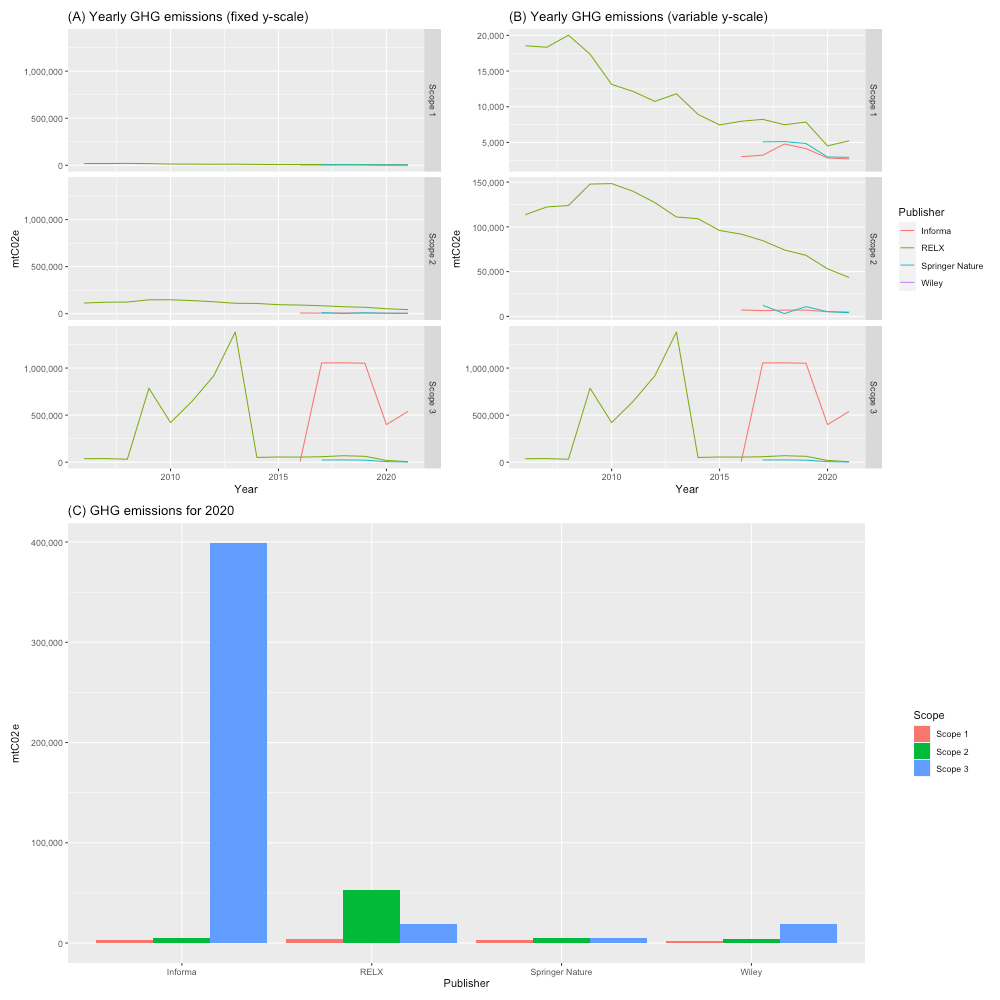
Panel A displays (1) direct, (2) indirect, and (3) value chain emissions across reported years with a fixed y-axis, allowing for easy comparisons across scopes. From this panel we can discern that, on average, scope 1 emissions are lower than scope 2 emissions, which in turn are lower than scope 3 emissions.
Panel B displays the same emissions across reported years with a variable y-axis, showcasing the changes over the years more clearly. Here we see that the emissions for scopes 1 and 2 are trending downwards overall, but scope 3 appears highly variable and as a result trends are harder to discern.
Panel C displays the emissions per publisher across the three scopes for the year 2020. This is the most recent year where four publishing houses reported and published their emissions, which allows for a better comparison. This panel indicates the scale of emissions from scope to scope.
Noteworthy fact: Summing up all reported emissions across publishing houses to date amounts to 10,784,088 metric tons of carbon dioxide equivalent (mtCO2e), i.e., 10.8 million mtCO2e.
The crux is in the detail. Or: How to understand these reported emissions
Looking at the reported emissions data of these publishing houses, Figure 1 points to a few curious outliers and some drastic changes that deserve more detailed attention.
In Panel A for instance, RELX appears to report a significant reduction in scope 3 emissions for the year 2014. However, looking more closely at their reporting methodology, we found that the decrease is a result of excluding previously included categories, namely emissions related to their suppliers. In other words, while reported emissions decreased, actual emissions have not. In fact, RELX’ 2020 report states “supply chain emissions were approximately 14 times larger” (p.70) than reported emissions.
It is common that a company’s scope 3 emissions amount for about 60-80% of their overall impact. Interestingly, the more digital their operations and services, the larger that difference, with some companies reporting up to 99% of their emissions across their value chain.
We can see this ratio of scope 3 emissions in the example of Informa (Figure 1, Panel C). In 2020, Informa’s (parent company of Taylor & Francis) scope 2 emissions are 1.88 times larger than scope 1, and scope 3 emissions are 75.18 times larger than scope 2. Put more concisely, the scopes 1-2-3 relate 1:1.88:75.18 in scale or 1%-2%-97% in percentages.
The relative size of value chain (scope 3) emissions is also highly relevant for the climate commitments of these publishers.
In 2021, RELX, for example, announced that they “launched [their] new environment targets which include a target, set using the science-based target methodology, to reduce emissions by 46% in 2025 against a 2015 baseline.” This is the baseline calculated after dropping significant portions of their scope 3 emissions in 2014.
Now, both, RELX and SpringerNature joined The Climate Pledge which commits them to achieving net-zero emissions across all scopes by 2040 at the latest. This will necessarily require them to include additional scope 3 categories in their upcoming reports, including purchased goods and services, digital infrastructures, and use of product.
Similarly, in 2020, Wiley posited: “Our Global Operations Carbon Footprint is certified 100% Carbon Neutral across all of Scope 1 and 2, and part of Scope 3 (business travel and distribution of product).” This commitment, however, reflects only 2 out of 15 scope 3 categories, with the remaining impact likely to be a multiple of what is currently reported.
On the plus side, four of the major scholarly publishers regularly report and publish their emissions data (if selectively), while Sage, STM, and the Publishers Association do not. It is also worth noting that all publishers place particular emphasis on sourcing and recycling paper as a critical resource to their businesses. As more and more research is published online, the impact of digital infrastructure is set to increase and will require a closer look as well.
We need better and best practices
If there is one thing this analysis shows, it is that we need emissions data to be transparently shared and easily comparable. Manually assessing the data and reading through footnotes or separate methodology documents to make sense of the presented information does not scale, and it does not spur the necessary climate action. Ideally, emissions data is shared in a machine-readable format to allow for cross-publisher comparisons and automated visualizations. To our knowledge, no machine-readable standard for emissions data exists.
Informa‘s data sharing and presentation stands out as a positive example: All scopes and categories are accounted for, indicating 0 emissions for the non-applicable ones. In other instances, the focus on narrative reporting buries comparable data points in lengthy copy of 100 pages and more. The fact that large parts of the copy are repeated word for word, year after year after year, also indicates that neither progress nor learning happens ‘in the story’ of the report. It is the categories each publishing house chooses to focus on and track that improve over time. In other words, the better we understand what to measure and how, the better we can engage, internally and externally, to mitigate and reduce our emissions.
It is also noticeable that the focus on scope 1 and 2 – in line with legal (minimum) requirements, paints a distorted and outdated picture. Digital workspaces, cloud services and hosting infrastructures for online publishing will continue to gain in relevance. Their impact will only be accounted for if we measure scope 3 emissions.
That means if we want to invest in and build sustainable research infrastructures, we need to do more. We need complete, comparable, and machine-readable datasets that allow us to understand where our emissions are coming from and then work to actively reduce them.
It is on that note we also reflect on the need to develop new practices for open research initiatives to track and report on their emissions. Granted, the big publishing houses are required by law to account for and publish their environmental impact. This is why they’ve been doing so for years, albeit selectively and with plenty of room for improvement. Yet, how can we raise the bar, improve our understanding, reduce emissions ,and hold them to account if researchers, open initiatives, and publishing alternatives don’t assess their own emissions? This year’s International Open Access week (Oct 24-30, 2022) is themed “Open for Climate Justice” – what better opportunity to commit and lead the way towards necessary best practices of GHG accounting and climate action?
For these and many more reasons, we proposed a statement on emissions reporting in the Principles of Scholarly Infrastructure, under the header of Sustainability:
Copyright © 2022 Cathleen Berger, Chris Hartgerink. Distributed under the terms of the Creative Commons Attribution 4.0 License.